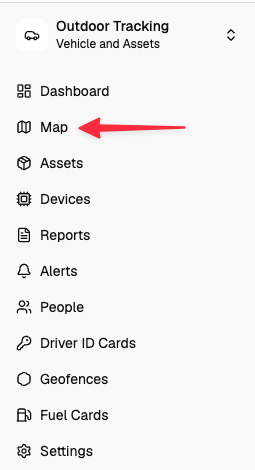
Navigate to the map page.
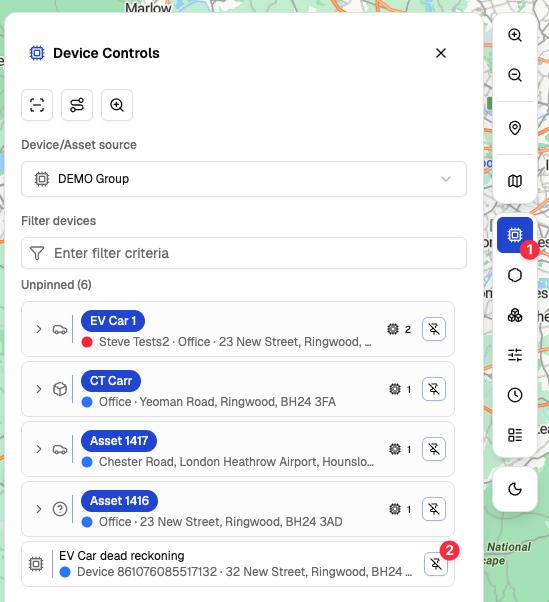
Open the device controls and pin one or more assets.
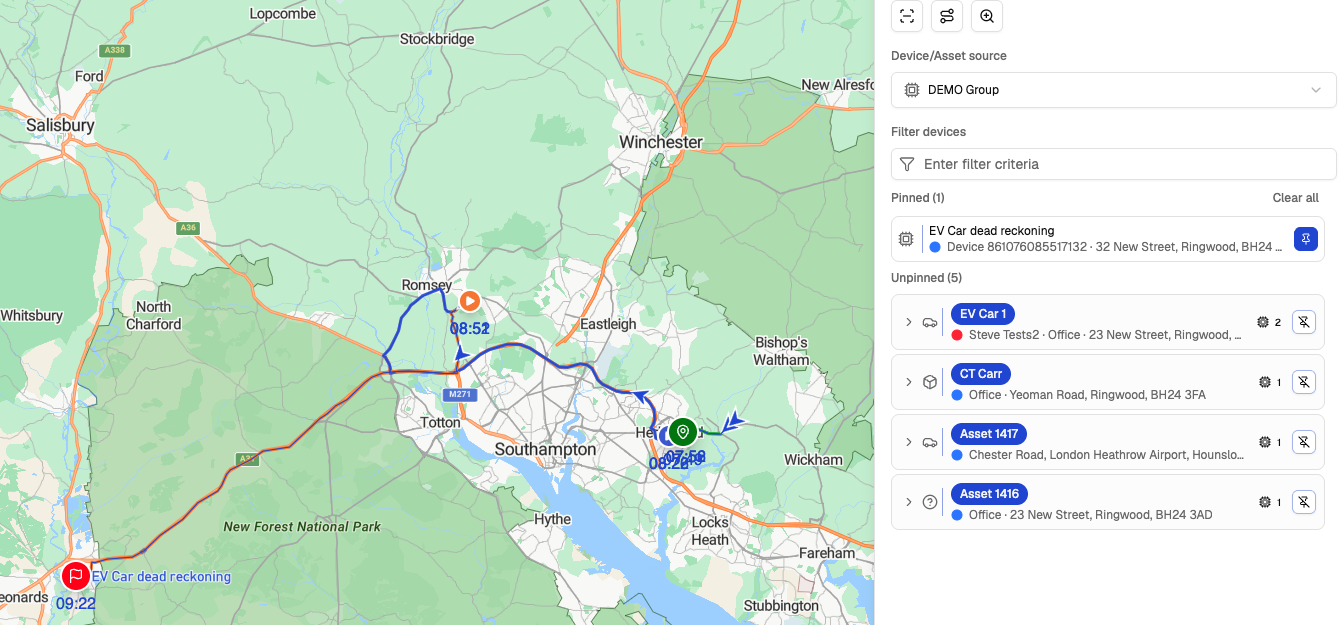
Once the asset is pinned, it will appear under the pinned section and today’s movements will appear on the map. You can now close the device controls panel, as this is no longer needed, by pressing ‘d’ on your keyboard or clicking the icon again.
Now press ‘e’ on your keyboard to open the timeline.
1 – This shows the timeline start date/time (the end time is in the top right of the timeline)
2 – The coloured boxes show where trips have occurred
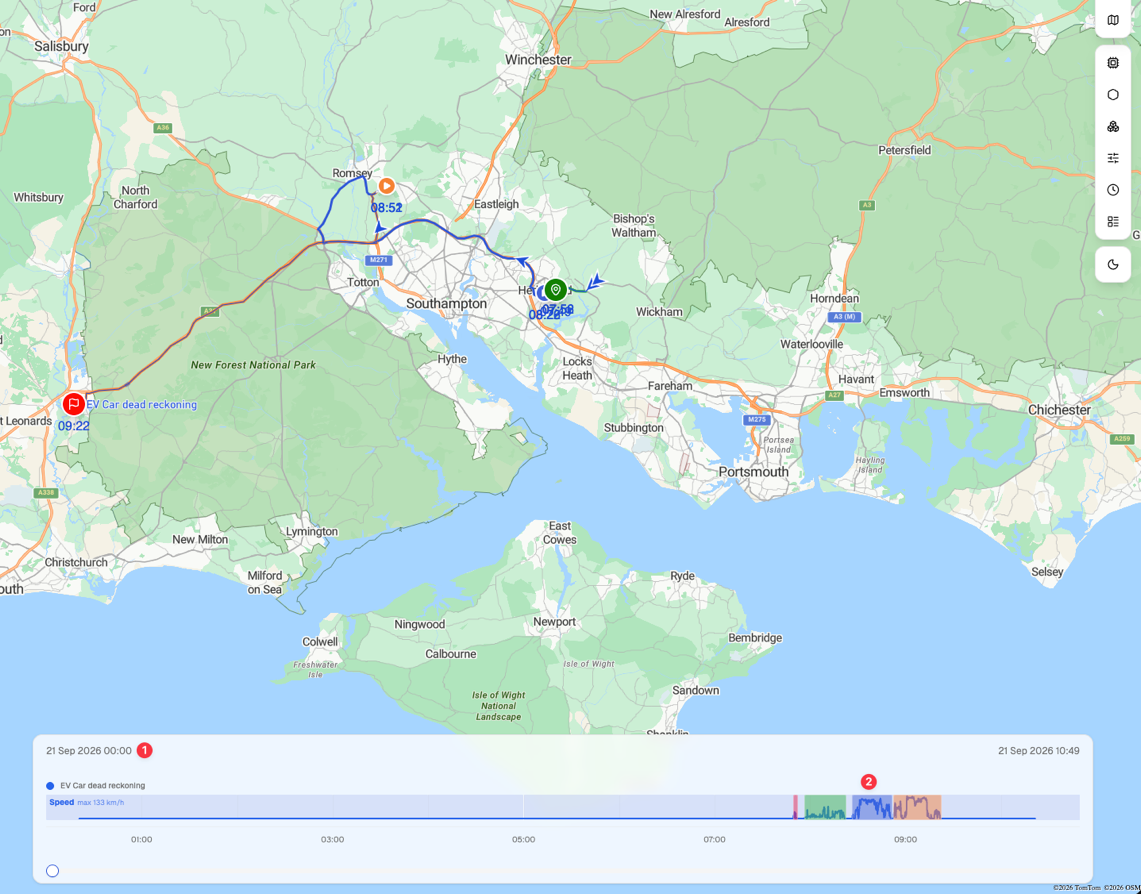
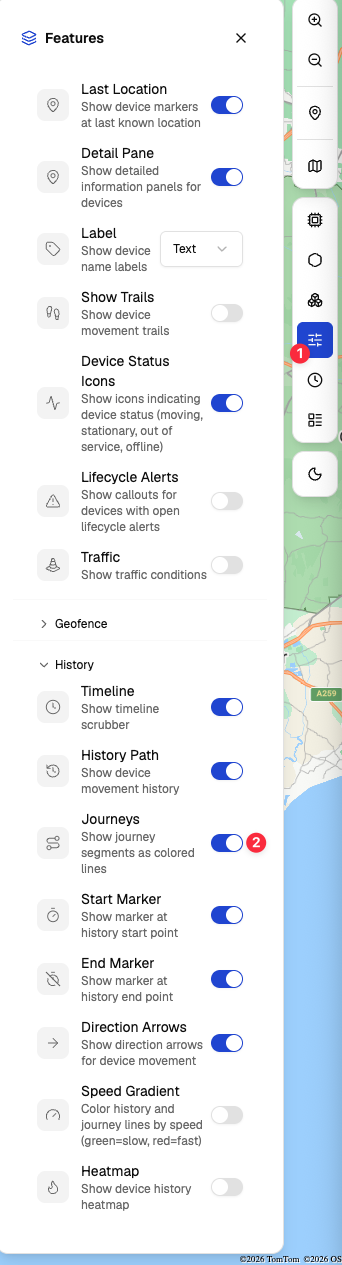
If you don’t see the coloured boxes, go to the features panel and toggle on ‘Journeys’.
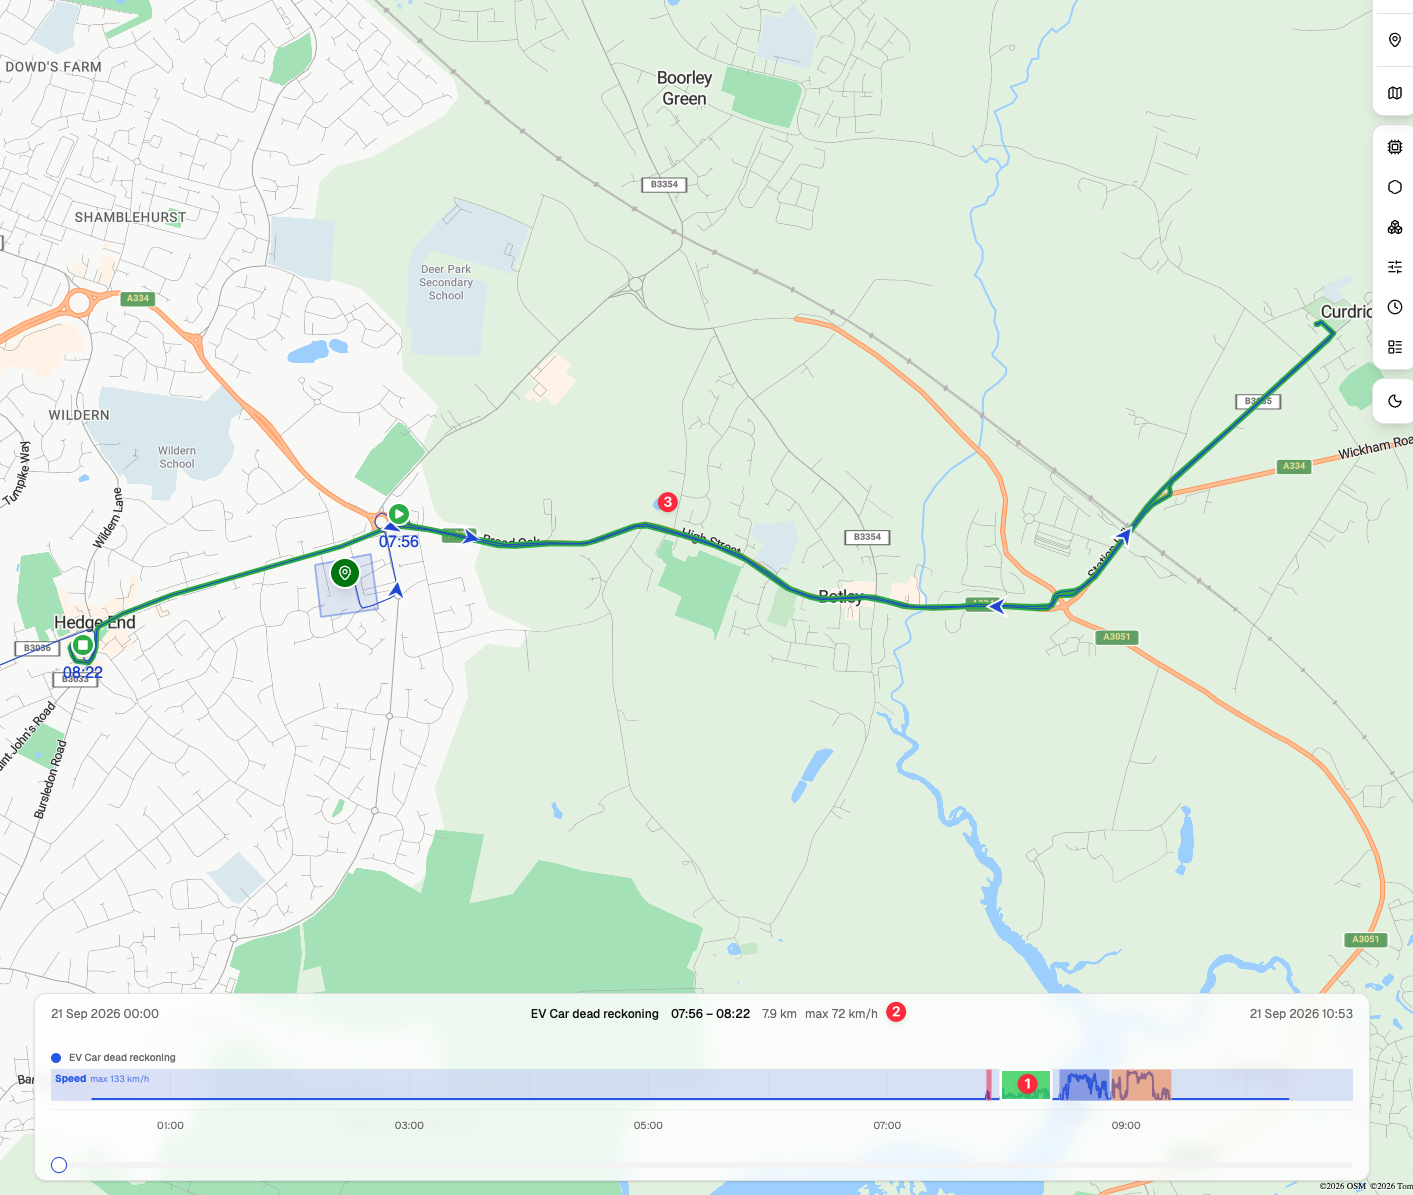
Clicking on a coloured box highlights this journey on the map.
- Select the journey
- Gives you the start/end times, distance and max speed for this journey
- The map now shows this one trip; the colour box and the trip share the same colour
The data shown is related to the current day; to look at historical data there are two methods.
Quick view (up to 7 days)
On your keyboard, you can press numbers 1–7; this will result in it showing data for the selected number of days. The image below shows the search being extended by 1 day, up to 4 days.

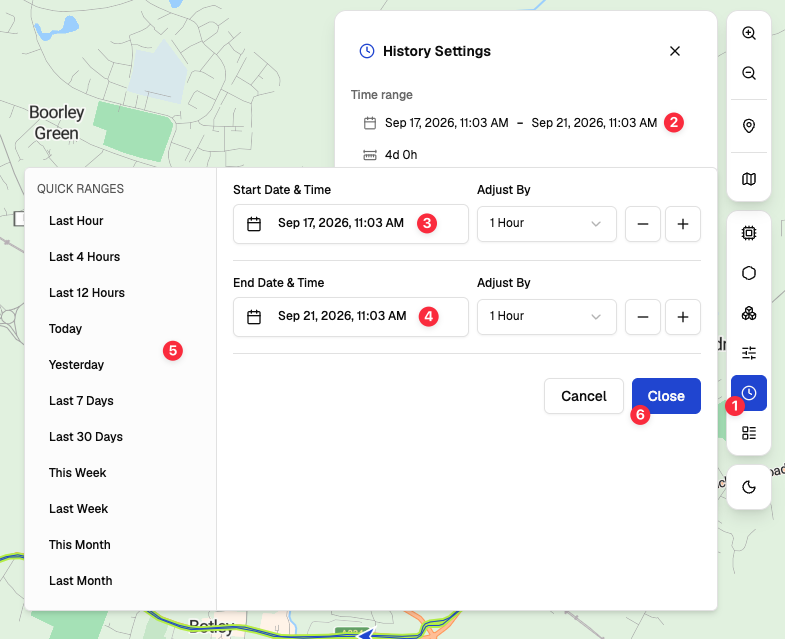
Time range picker (up to 3 months)
- Select historical data settings
- Shows the current date range selected, click to expand this
- Choose the start time
- Choose the end time
- There are also some preset time ranges for quick searching
- Press ‘Close’ to confirm the selection
How to look further into the timeline
As you can see below, a few journeys have been completed, but they’re all within a small timeframe.

To see this in better detail, click and drag your mouse over the section you would like to view.

Adding data to the timeline
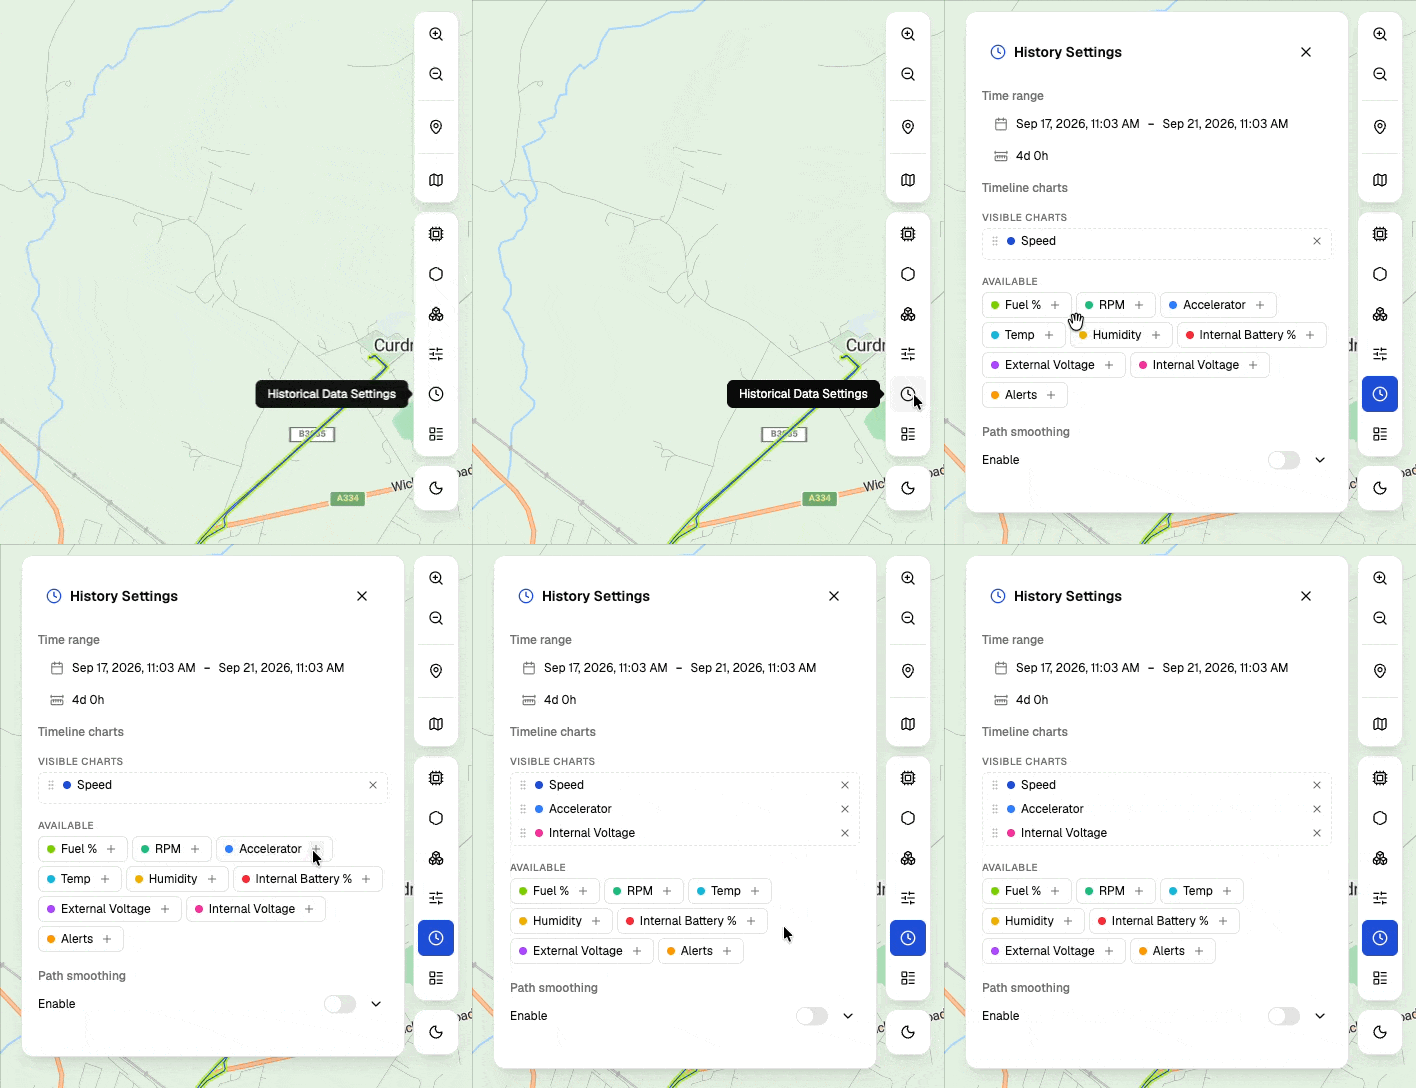
Click historical data settings, then select the extra data points. They will appear in the timeline.